

Headline sales figures only tell part of the story in U.S. cannabis. The real signal for investors sits in how much cash operators actually keep after costs, taxes, and competition. This guide breaks down where profit pools are strongest, using a model that cuts through surface-level growth metrics.
Disclaimer: Informational purposes only; Not investment advice.
What this ranking measures
This ranking is built around a single unit that separates market size from market profitability: a state-level EBITDA profit pool, defined as the estimated total EBITDA dollars generated by licensed, plant-touching operators in a state over a defined period.
The core math is intentionally simple:
Profit pool (EBITDA $) = Licensed retail sales ($) × Estimated statewide EBITDA margin (%)
EBITDA is used here because it is a standard operating profitability lens in financial modeling, before interest, taxes, depreciation, and amortization. For U.S. cannabis, it also helps avoid distortions from IRC 280E, which hits after operating profit and varies sharply by company structure.
Two important boundaries:
- This is a state-level industry view, not a single-company forecast. A great operator can outperform a weak state, and miss in a strong one.
- The EBITDA margin is modeled, not directly reported by regulators. The model uses state-specific market structure signals that investors actually care about: competition intensity (license density/retail saturation), tourism/cross-border demand, and illicit-market pressure.
The geographic scope is the United States, and the “market” unit is a U.S. state.
How the ranking model is built

Layer one measured: licensed retail sales
The measured layer starts with the available statewide sales total from official sources:
- When a regulator publishes annual sales totals directly, those are used.
- When statewide sales are not published as one clean annual number, the sales layer is triangulated from:
- official tax-base tables (sales estimated from collections), or
- official cannabis excise tax revenue divided by the statutory rate (when the tax is a straight percentage of retail selling price).
Layer two modeled: state-specific EBITDA margins investors can use
Margins are driven by factors that tend to move together at the state level:
- Illicit-market pressure: When a large share of consumption stays unlicensed, legal operators typically face price compression and weaker store-level unit economics. California is the clearest case: reporting citing California Department of Cannabis Control estimates that licensed sales are still under 40% of consumption.
- Competition intensity (license density): A high number of operators relative to demand tends to push margins down through discounting, wholesale compression, and high customer acquisition costs.
- Tourism / cross-border demand: Markets that capture substantial out-of-state spend can support higher sales per store and steadier utilization. Illinois publishes out-of-state sales explicitly, making it one of the cleanest cross-border signals in the country.
Because state-level margins are not reported, this guide uses explicit EBITDA margin ranges by state and ranks using midpoint margins. The ranges are designed to be narrow enough to be decision-useful and wide enough to reflect real uncertainty.
The ranking and the math
The table below ranks each state by estimated annual EBITDA dollars (profit pool). “Sales” are the best available statewide licensed retail totals over the latest available 12-month period as of March 5, 2026 (some states publish by calendar year, others by fiscal year, and a few by rolling reported quarters).
| Rank (by EBITDA $) | State | Sales period used | Licensed retail sales ($B) | EBITDA margin range | EBITDA margin midpoint | EBITDA profit pool midpoint ($M) | EBITDA profit pool range ($M) |
|---|---|---|---|---|---|---|---|
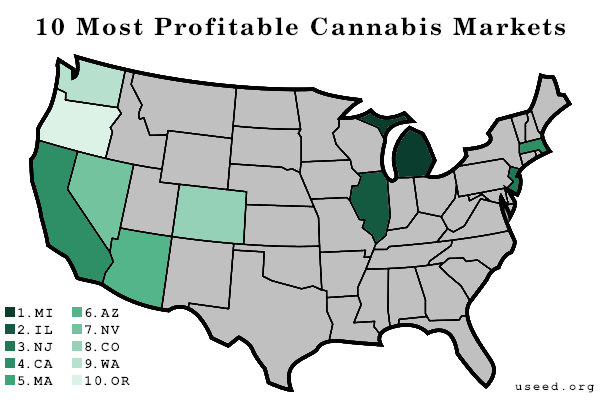
| 1 | Michigan | CY2025 | 3.183 | 10–14% | 12.0% | 382.0 | 318–446 |
| 2 | Illinois | CY2025 | 1.507 | 18–26% | 20.0% | 301.3 | 271–392 |
| 3 | New Jersey | latest 4 reported quarters | 1.160 | 22–30% | 25.0% | 290.0 | 255–348 |
| 4 | California | CY2025 (modeled from excise) | 3.861 | 4–8% | 6.0% | 231.6 | 154–309 |
| 5 | Massachusetts | CY2025 (adult-use) | 1.650 | 12–16% | 14.0% | 231.0 | 198–264 |
| 6 | Arizona | CY2025 (modeled from tax base) | 1.215 | 14–18% | 16.0% | 194.4 | 170–219 |
| 7 | Nevada | FY2025 | 0.758 | 18–25% | 20.0% | 151.5 | 136–189 |
| 8 | Colorado | CY2025 (projected) | 1.316 | 8–12% | 10.0% | 131.6 | 105–158 |
| 9 | Washington | FY2025 (modeled from excise) | 1.185 | 6–10% | 8.0% | 94.8 | 71–118 |
| 10 | Oregon | CY2025 | 0.925 | 5–9% | 7.0% | 64.8 | 46–83 |
Sales inputs are sourced from: California Department of Tax and Fee Administration (data portal); Michigan Cannabis Regulatory Agency (monthly report); Illinois Department of Financial and Professional Regulation (sales figures page); Massachusetts Cannabis Control Commission (sales reports page); Colorado Department of Revenue (sales reports page); Arizona Department of Revenue (excise tax table); Washington State Liquor and Cannabis Board and Washington Department of Revenue (annual report); Nevada Cannabis Compliance Board (biennial report); New Jersey Cannabis Regulatory Commission(sales reports page); and Oregon Liquor and Cannabis Commission (market data).
One worked example
Michigan is a good example of “big + pressured pricing.”
- The CRA monthly reports publish cumulative “Sales To Date” values for adult-use as of each month-end.
- Using those official cumulative totals, calendar-year 2025 adult-use sales are computed as:
CY2025 sales = Sales-to-date(Dec 31, 2025) − Sales-to-date(Dec 31, 2024)
Michigan also shows steep price compression in the regulator-reported average retail flower price per ounce (a margin headwind), which is why the margin range is not set anywhere near “limited license” levels.
What’s driving profitability in each state

Michigan leads this list because it combines very large licensed sales (measured directly from official CRA cumulative totals) with a margin assumption that stays above single digits even after acknowledging aggressive price compression visible in the reported average retail flower price data.
Illinois ranks above several larger-sales states because it behaves like a high-quality “regional demand magnet” market. Its regulator reports both total annual sales and an explicit out-of-state component ($163.56M out of $1.506B in 2025), which supports a structurally stronger margin assumption than open-license, high-saturation states.
New Jersey sits high on profit pool despite smaller sales than California because the market structure is closer to limited access and controlled rollout. The Commission’s own high-level reporting shows strong sales across the most recent four reported quarters, supporting the view that operator unit economics can remain strong even without a top-five national sales number.
California remains the largest market by sales, but its modeled profit pool is capped by structural margin pressure. Two signals dominate:
- Reported declines and volatility in taxable sales and cannabis tax revenue, and
- Persistent illicit-market capture (licensed share estimated below 40% of consumption).
Sales are triangulated using CDTFA cannabis excise collections and the statutory excise rates in effect during 2025, including the temporary 19% rate window and the later return to 15%.
Massachusetts is the cleanest “official sales total” market on this list. The CCC publishes an annual adult-use sales figure for 2025 ($1.65B).
Because the market is mature and competitive, the margin assumption is conservative relative to limited-license markets—even though the demand base is large.
Arizona is a strong mid-sized market in profit pool terms because it combines billion-plus retail sales with a tax structure that provides enough public data to model sales from official tax-base reporting. The Arizona Department of Revenue’s table explicitly notes that taxable sales are estimated from revenue received and can shift with reconciliations, which is why this state’s “sales” figure is treated as an estimate even though it is regulator-sourced.
Nevada’s measured sales used here come from the Nevada Cannabis Compliance Board’s fiscal-year taxable sales release.
In practice, Nevada is often treated as “tourism amplified,” which is the rationale for keeping margins closer to limited-license markets than oversupplied markets. (The sales period is fiscal-year, so we compare directionally rather than treating it as a pure calendar-year number.)
Colorado’s 2025 sales are projected because the state’s reporting cadence can leave the final month lagging. The approach here uses:
- Official 2025 year-to-date totals through November, plus
- a December estimate anchored to historical November–December seasonality in the state’s historical series.
A mature, highly competitive structure supports a mid-single to low-teens margin range rather than anything resembling early-cycle scarcity margins.
Washington is modeled from excise tax collections reported in the WSLCB FY2025 annual financial statements and the state’s 37% cannabis excise structure.
Profitability is discounted because Washington’s official oversight work points to long-running structural oversupply and market stress, which are classic margin killers in commodity-style cannabis categories.
Oregon rounds out the top 10 because annual licensed sales are still close to a billion dollars, but the profitability outlook is constrained by severe price compression and oversupply. OLCC market data puts 2025 sales around $925M and reporting highlights extremely low median retail pricing (e.g., $3.33/gram in December) and record production volumes.
Practical limitations
This ranking is intended for investors to treat it like a screen, not a final underwriting conclusion.
Margin sensitivity is the dominant variable. A simple rule of thumb:
- Every +1 percentage point change in EBITDA margin is worth +1% of sales in EBITDA dollars.
- For a $1.5B market, that’s $15M of EBITDA swing per margin point.
- For a $3.8B market, that’s $38M per point.
That sensitivity is why the table carries explicit margin ranges and why markets like California can move several slots if the illicit/price environment shifts materially.
Other limitations:
- Some sales totals include taxable bases that may capture non-cannabis items (e.g., accessories) depending on state definitions, which can slightly overstate cannabis-only revenue; others rely on excise bases designed to be closer to cannabis product receipts.
- Reporting periods are not perfectly harmonized: some states publish calendar-year totals, others fiscal-year totals, and some publish rolling quarters. The table calls that out explicitly in the “sales period used” column.
- State-level profit pools can be skewed by vertical integration norms. A state where most value accrues at retail will look different from a state where wholesale margins dominate, even at the same retail spend.
How to use this list for financial work
A profit-pool ranking is most valuable when paired with a short set of underwriting questions:
Start with the top states, then ask:
- Which of these markets has a credible path to margin expansion (license rationalization, enforcement against illicit sales, tax relief, wholesale stabilization)?
- Which markets are “big but structurally leaky,” where sales growth does not translate into operator cash generation (California is the flagship case in the current cycle, given the legal share of consumption challenge)?
- Which markets have “earned” demand from out-of-state purchasers (Illinois is unusually transparent here), supporting more resilient store-level economics?
Used that way, the profit pool becomes a clean, investor-grade starting point: it tells you where the industry is likely generating operating profit dollars today, and where it is probably not, even if the sales headlines are large.